Live Runtime Control
This section covers the operational tools available for managing, auditing, and debugging active challenge runtime environments during a live competition.
Instances History
The Instances History page provides a comprehensive, searchable log of every challenge instance that has been provisioned across the platform, whether currently active or already stopped.
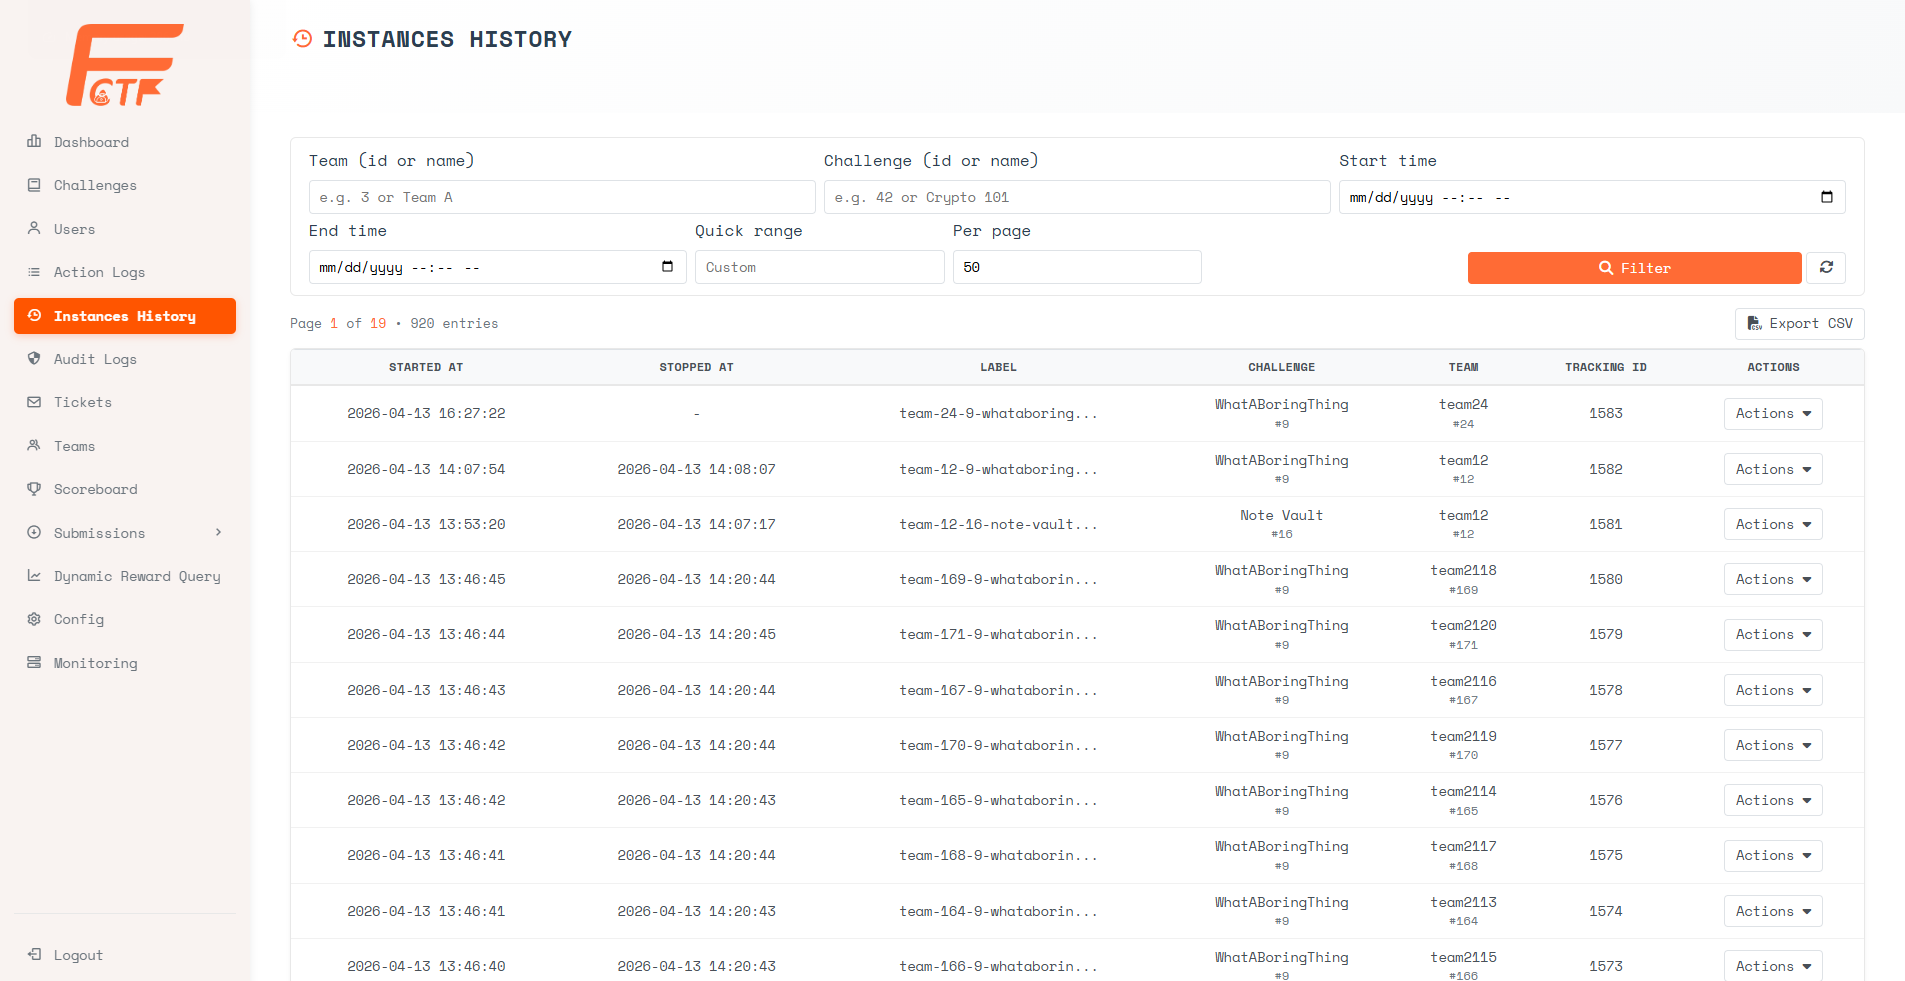
Filter Controls:
- Team (id or name) - Filter by a specific team identifier or name.
- Challenge (id or name) - Filter by a specific challenge identifier or name.
- Start time / End time - Narrow the results to a specific time window.
- Quick range - Select a preset window (e.g., last 1 hour, last 24 hours) for rapid filtering.
- Per page - Configure the number of entries displayed per page.
Table Columns:
- Started At - The timestamp when the instance was initially provisioned.
- Stopped At - The timestamp when the instance was terminated. Displays
-if the instance is still running. - Label - The Kubernetes namespace label assigned to the instance (e.g.,
team-24-9-whataborin...). - Challenge - The challenge name and its internal ID.
- Team - The team name and internal ID that owns this instance.
- Tracking ID - The unique deployment tracking identifier.
- Actions - Dropdown menu providing access to detailed logs.
Available Actions (per entry):
- Export CSV - Download the full instance history table for offline auditing.
Pod Logs
The Pod Logs viewer streams the raw stdout/stderr output directly from the challenge container running inside its Kubernetes pod. This is the primary tool for diagnosing application-level crashes, runtime exceptions, or incorrect server behavior.
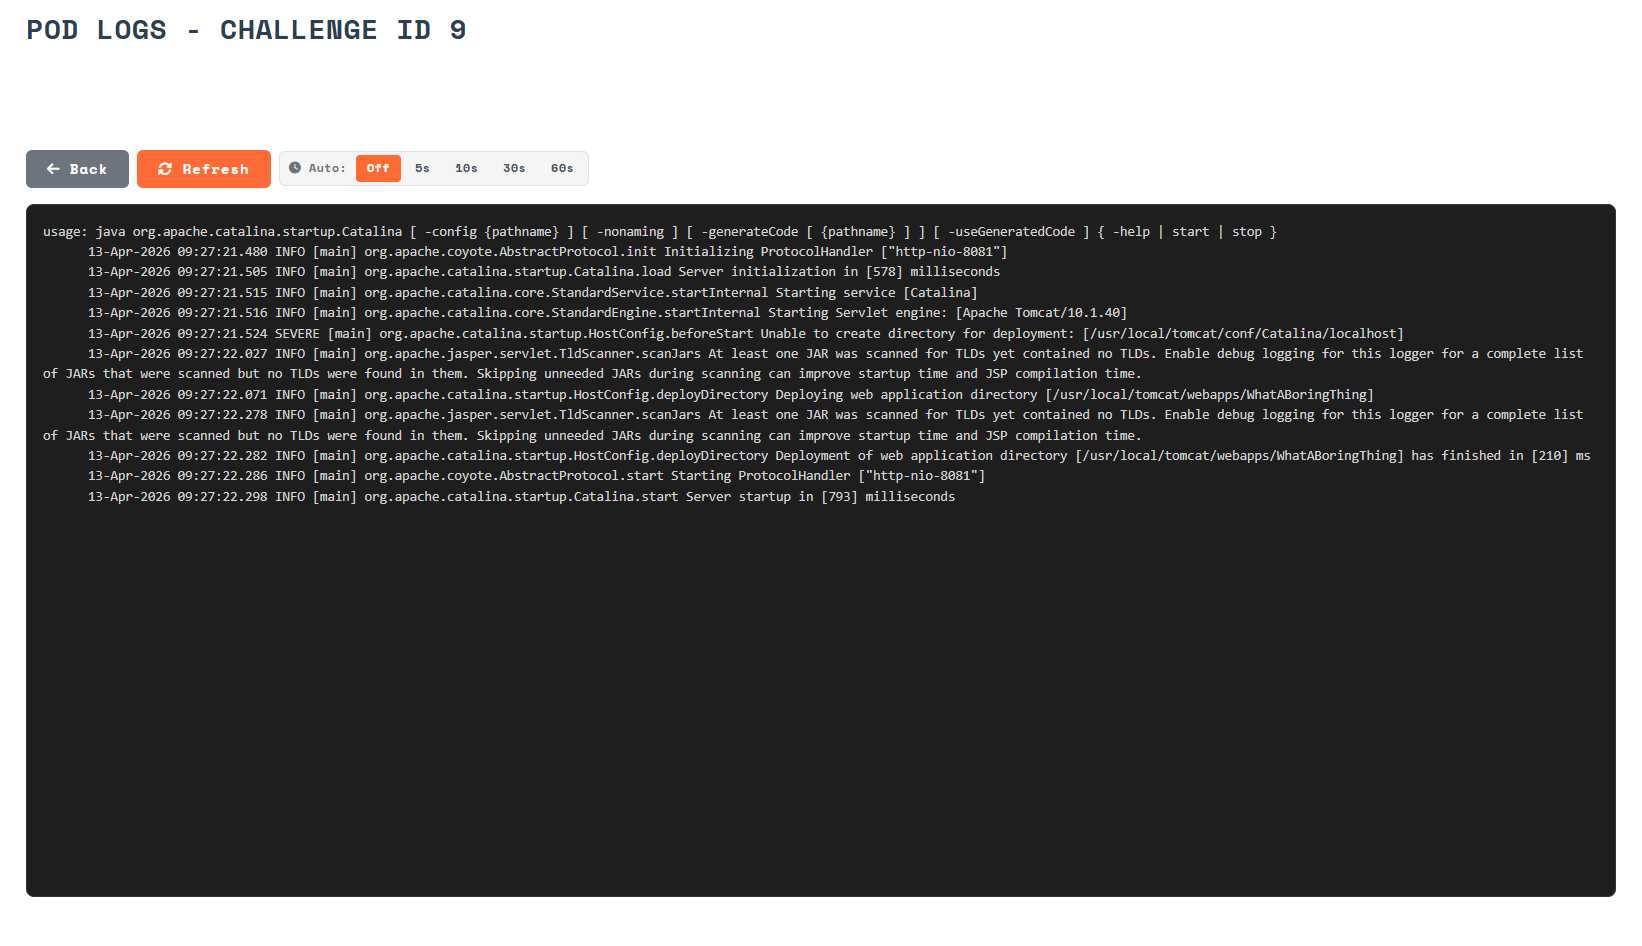
Controls:
- Back - Return to the previous page.
- Refresh - Manually fetch the latest log output.
- Auto-refresh - Toggle automatic polling at a configurable interval:
Off,5s,10s,30s, or60s.
Use Cases:
- Verify that the challenge application started correctly (e.g., observing Tomcat startup logs).
- Diagnose
SEVEREerrors or stack traces that would not be visible from the contestant's perspective. - Confirm that the application is listening on the expected port.
Request Logs
The Request Logs viewer streams the reverse-proxy access logs, showing every HTTP request that flows through the ingress gateway into the challenge instance. Each entry captures the full request path, HTTP method, and response status code.
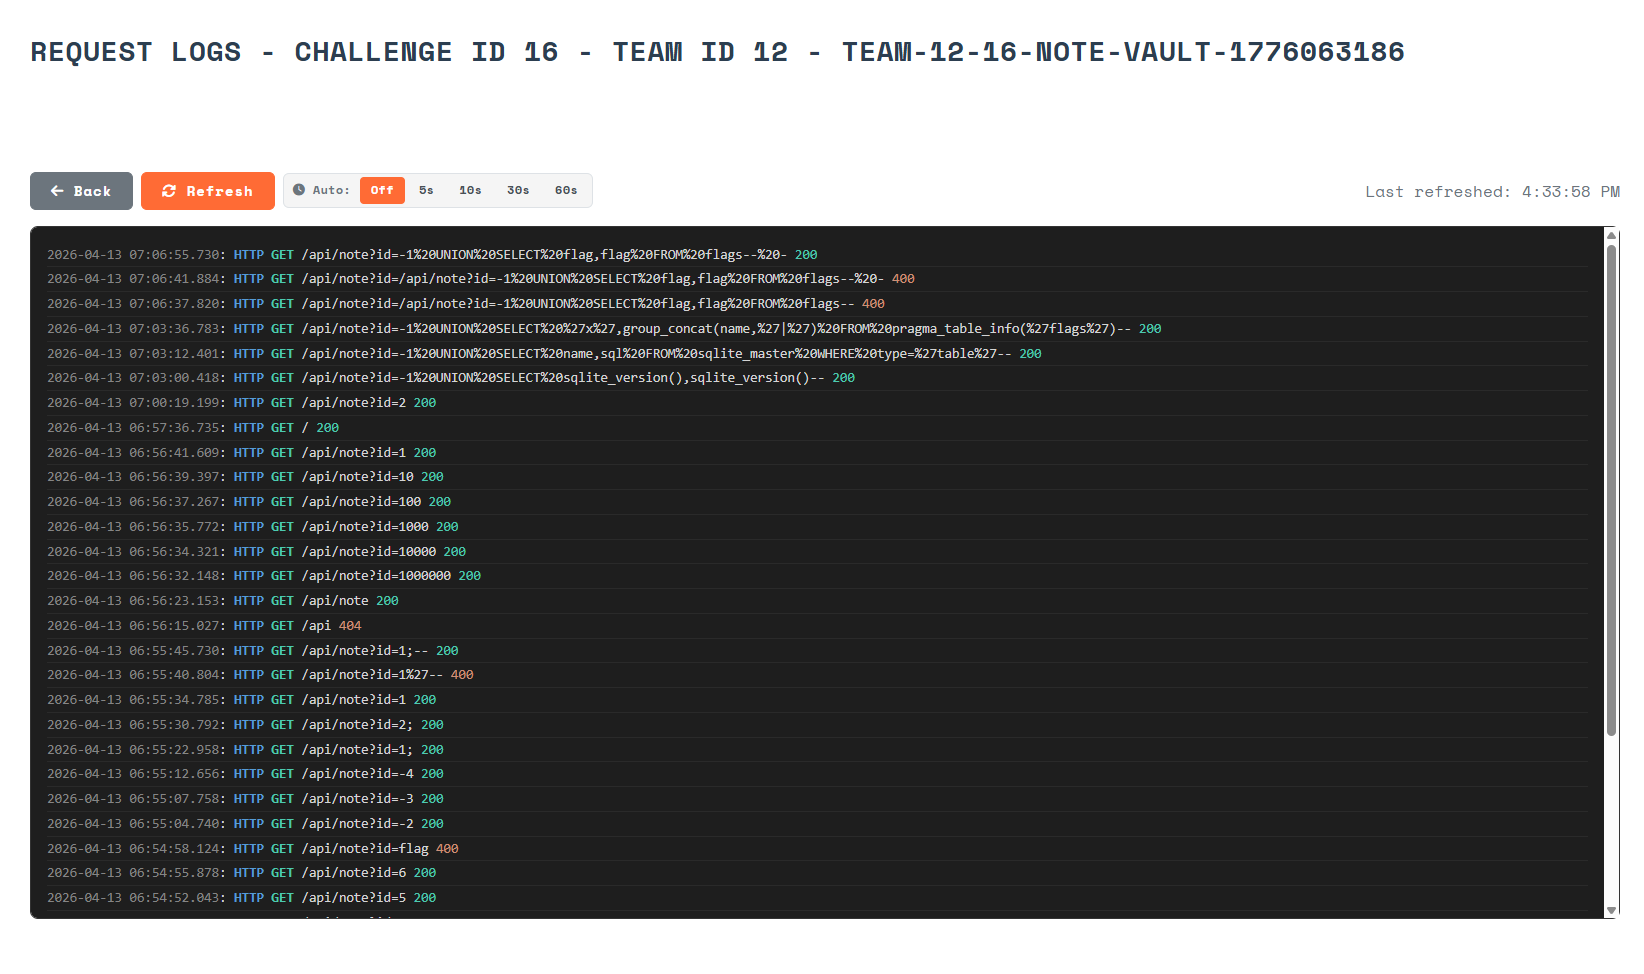
Controls:
- Back - Return to the previous page.
- Refresh - Manually fetch the latest log output.
- Auto-refresh - Toggle automatic polling at a configurable interval:
Off,5s,10s,30s, or60s. - Last refreshed - Displays the timestamp of the most recent data fetch.
Log Format:
Each line follows the pattern:
<TIMESTAMP>: HTTP <METHOD> <PATH> <STATUS_CODE>
Status codes are color-coded for quick scanning: 200 (green/success), 400 (orange/client error), 404 (red/not found).
Use Cases:
- Track SQL injection or path traversal payloads being sent by contestants to understand their attack approach.
- Verify that the contestant is reaching the correct endpoint.
- Detect unusual traffic patterns or brute-force submission attempts.